What Is an Expected Return?
Because a few extraordinary winners pull the average up, an investment's expected return is often well above what the typical outcome earns.
"It is absurd to denounce the majority of mankind as below the average of mankind." — G. K. Chesterton, Alarms and Discursions (1910), "The Red Town"¹
Chesterton was a master of paradox and observational humor, and he sought to defend the intelligence of ordinary men against those who would claim that most men are fools. His point depends, however, on one important but unstated assumption about the dataset in question, that of a symmetrical distribution.
There are many datasets in which the majority of observations fall below the arithmetic mean. In financial markets, this distinction is central to understanding the concept of expected return. The upshot is that because a few extraordinary winners pull the average up, a portfolio’s expected return is often well above what the typical holding will earn.
The Bell Curve
Most of us are used to thinking of distributions as roughly symmetrical and bell-shaped. Heights, exam scores, and countless other measurements cluster around a central value, with progressively fewer observations toward either tail. This kind of distribution is known as a normal, or Gaussian, distribution. In it the arithmetic mean, median, and mode are equal, half of the observations fall above the mean and half below, and Chesterton's quip holds.
But not every distribution is normal. Nassim Nicholas Taleb, in The Black Swan, warns us against superimposing assumptions of normality on non-normal distributions, "because the bell curve ignores large deviations, cannot handle them, yet makes us confident that we have tamed uncertainty."²
Daily U.S. equity market returns, available from the Kenneth French Data Library,³ illustrate the warning. Most days produce modest gains or losses, but extreme movements occur far more often than a normal distribution would predict. These unusually frequent extreme observations are called fat tails. From July 1926 through August 2026, the market moved more than four standard deviations (about 4.3%) in a single day 193 times; a normal distribution with the same mean and volatility predicts about two.
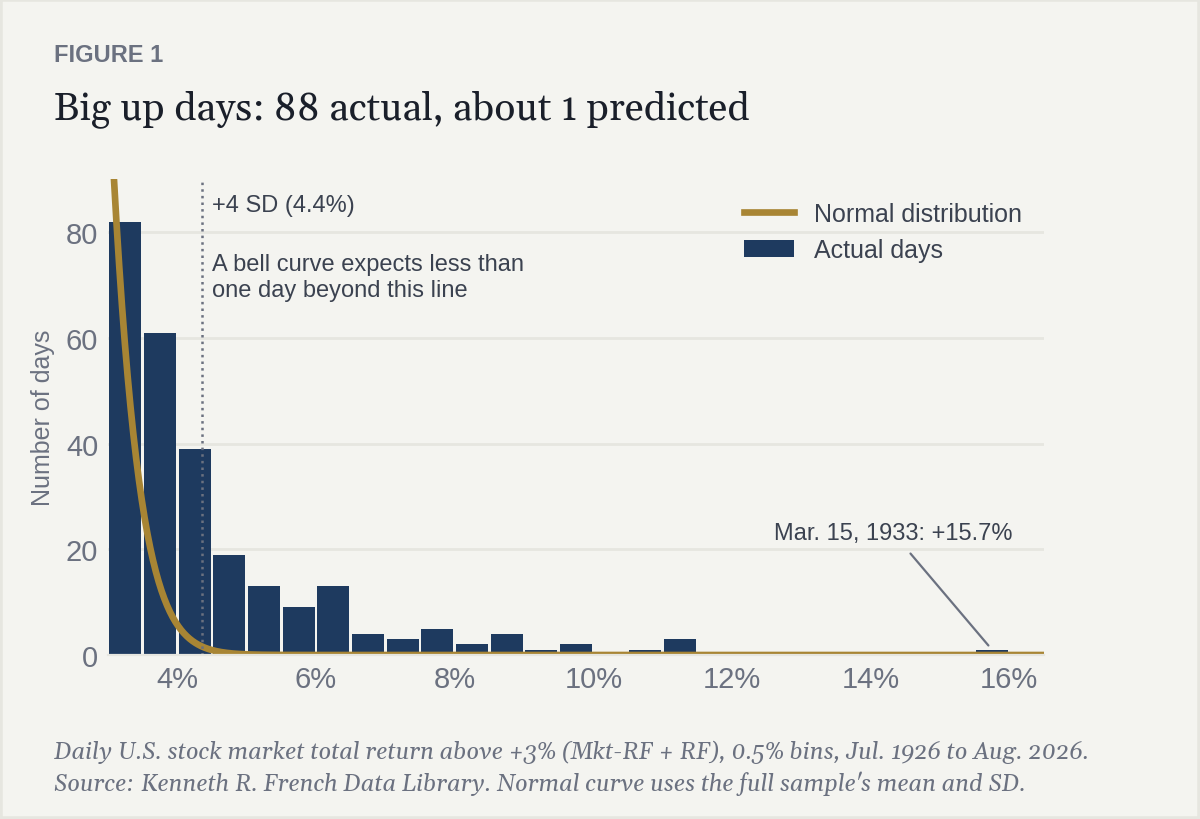
Fat tails alone, however, do not cause most observations to be below the average. A distribution can have extreme outliers on both sides and remain symmetrical. We are unable to adapt Chesterton's observation to financial markets because of a different departure from the bell curve, positive skew, in which a long tail stretches in one direction.
A Market of Extraordinary Winners
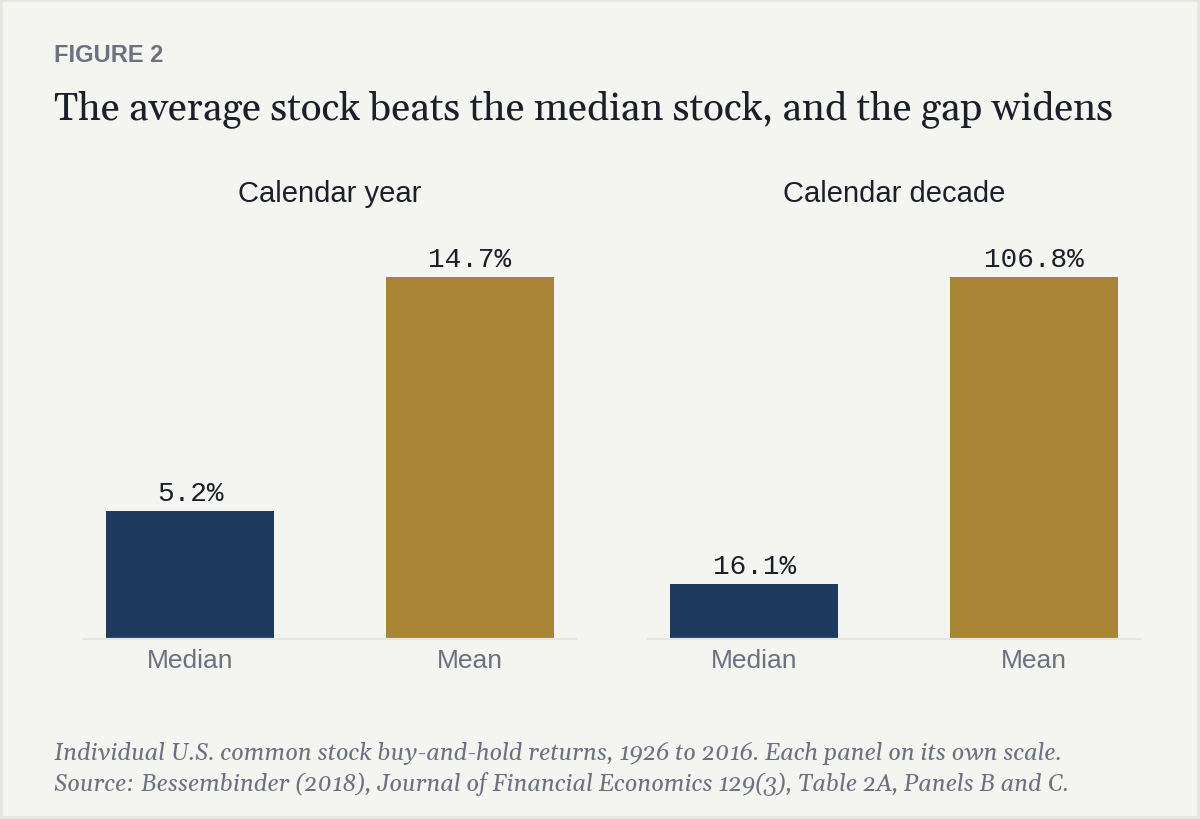
Equity returns deviate from normality across securities as well as over time. In his 2018 paper, "Do Stocks Outperform Treasury Bills?"⁴, Hendrik Bessembinder examined the lifetime returns of U.S. common stocks dating to 1926. Approximately 57% of individual stocks underperformed one-month Treasury bills over their lifetimes. Just 4% of companies accounted for the entire net wealth creation of the U.S. stock market between 1926 and 2016, measured relative to Treasury bills.⁵
The stock market creates so much wealth while most individual stocks fail to outperform short-term government debt because long-run individual stock returns are positively skewed. Unlike a normal distribution, their distribution has a pronounced right tail. An investor can lose no more than 100% of an initial investment, but a successful investment can appreciate many times over. A relatively small number of spectacular winners lifts the average return far above the experience of the typical stock. Bessembinder finds the gap between mean and median even within single calendar years, and compounding widens it over decades.
Consider ten equally likely outcomes: nine return nothing, while one returns 200%. The arithmetic average is 20%, even though 90% of the outcomes fall below that average. Most observations can indeed fall below average when extraordinary winners exert disproportionate influence upon the mean.
What, Then, Is an Expected Return?
An expected return is the probability-weighted average of all possible returns on an investment. It is not necessarily the most likely return or the median return, and it is not a prediction of what an investor will earn in any particular year.
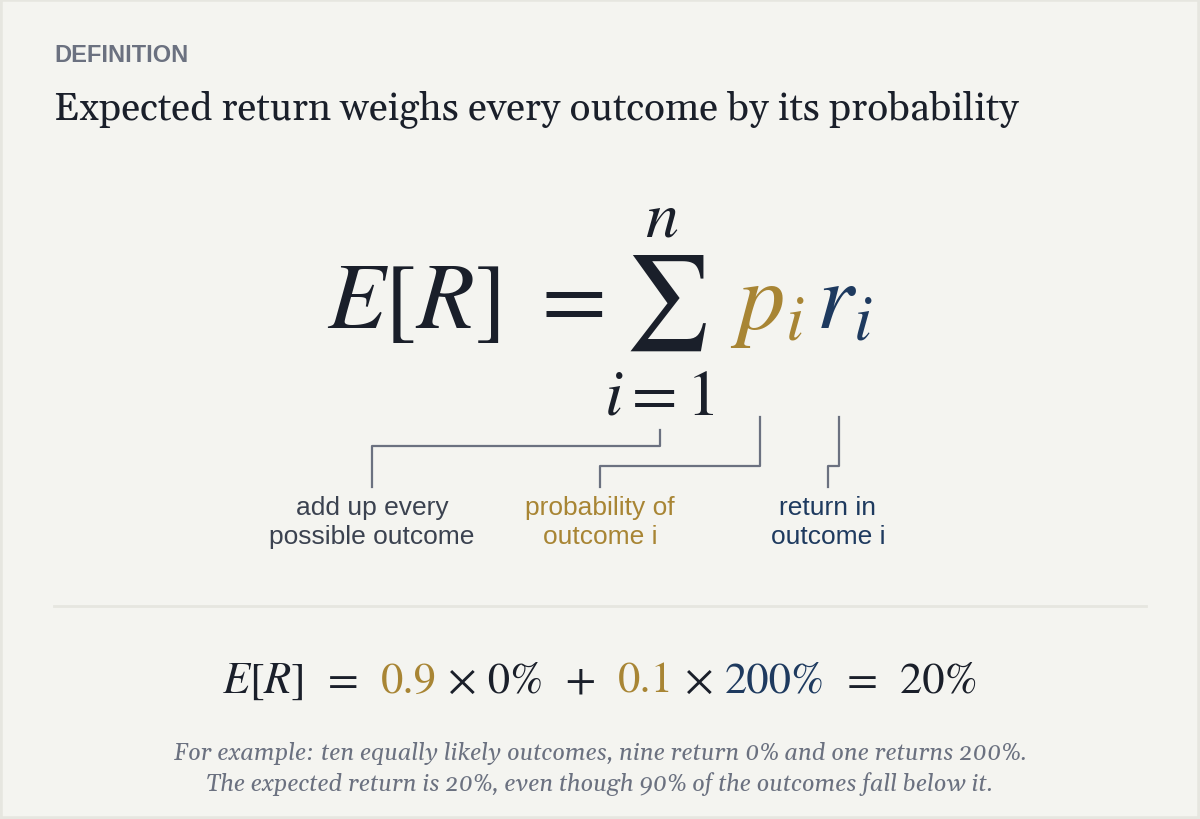
The distinction matters most when returns are positively skewed. A small probability of an extraordinary outcome can materially influence an investment's expected return, even when the most probable outcome is considerably less attractive.
This also helps explain the importance of diversification. If we cannot reliably identify tomorrow's exceptional performers, concentrating our investments in a handful of supposedly promising companies risks excluding the stocks responsible for much of the market's wealth creation. Diversification protects against individual failures and preserves our opportunity to participate in extraordinary successes.
Expected return still matters. Any single year's result is dominated by chance, but over many years a portfolio's average return tends toward its expected return, and small differences compound. Holding risk constant, a higher expected return raises the typical long-run outcome as well as the average one. That is why it is worth pursuing.
Not every security offers the same expected return. The research of Eugene Fama and Kenneth French⁶ provides a framework for understanding systematic differences in expected returns across securities and portfolios. We will examine that research, and its implications for portfolio construction, in a future letter.
Chesterton was right to defend the ordinary man. But in financial markets, the extraordinary can determine the average.
¹ Chesterton, G. K. (1910). "The Red Town." Alarms and Discursions. Methuen & Co. See also the American Chesterton Society, "Lecture 116: The General of Generalization".
² Taleb, N. N. (2007). The Black Swan: The Impact of the Highly Improbable. Random House.
³ Kenneth R. French Data Library.
⁴ Bessembinder, H. (2018). "Do Stocks Outperform Treasury Bills?" Journal of Financial Economics, 129(3), 440–457. doi:10.1016/j.jfineco.2018.06.004. Free working-paper version: SSRN 2900447.
⁵ Bessembinder's lifetime analysis compares stocks with differing lifespans, and longer-lived companies have more opportunity to compound into extraordinary returns. He tests whether the result persists over more comparable horizons, including stocks that enter or leave the market for the periods they were listed. It does: across calendar decades, just 37.3% of stocks outperformed the capitalization-weighted market. The 4% finding concerns aggregate dollar wealth creation relative to Treasury bills, which also reflects company size, rather than the distribution of individual percentage returns. See Bessembinder (2018), Table 2A.
⁶ Fama, E. F., & French, K. R. (2015). "A Five-Factor Asset Pricing Model." Journal of Financial Economics, 116(1), 1–22. doi:10.1016/j.jfineco.2014.10.010.
This newsletter is general education and is not investment, tax, or legal advice.