How does a moral screen affect your portfolio?
We focus here on tracking error, which depends heavily on whether a screen excludes any of the market's largest companies.
This week we measure the portfolio impact of screening, using a published Catholic index and Bloomberg's portfolio optimizer.
In Letter No. 1 we argued that a principled portfolio should be judged by the same standards as any other, and in Letter No. 2 that broad diversification made investors owners of nearly everything. If a screened portfolio is held to the standard of the diversified market it is drawn from, the next question is what screening costs investors.
There are many ways to look at a screen's effect on a portfolio. The first that comes to mind is the percentage of the market the screen removes, whether measured by market value or by number of securities. That percentage is easy to find and understand, but on its own it says little about what the screen is doing to the portfolio. A screen that removes many small companies may barely change how a portfolio behaves, while one that removes a few large ones can change it a great deal.
One of the most common measures of portfolio impact is ex ante tracking error.
Tracking error is defined as the standard deviation of the difference between a portfolio's return and its benchmark's return. In other words, it is a more precise way to see whether, and how far, a screen is leading a fund away from its benchmark. A portfolio with 1% tracking error should land within about one to three percentage points of its benchmark—above or below—in most years. Critically, unless the screen also raises the portfolio's expected return, the investor is taking that detour without being compensated for it.
To measure tracking error, we used Bloomberg's portfolio optimizer¹ to build portfolios that track the Bloomberg US 3000 Index as closely as possible, with a name-count ranging from about 60 to about 470. We allowed the optimizer to buy only companies that are also in the Bloomberg US 3000 Catholic Values Index,² which applies Catholic exclusions to the same universe.
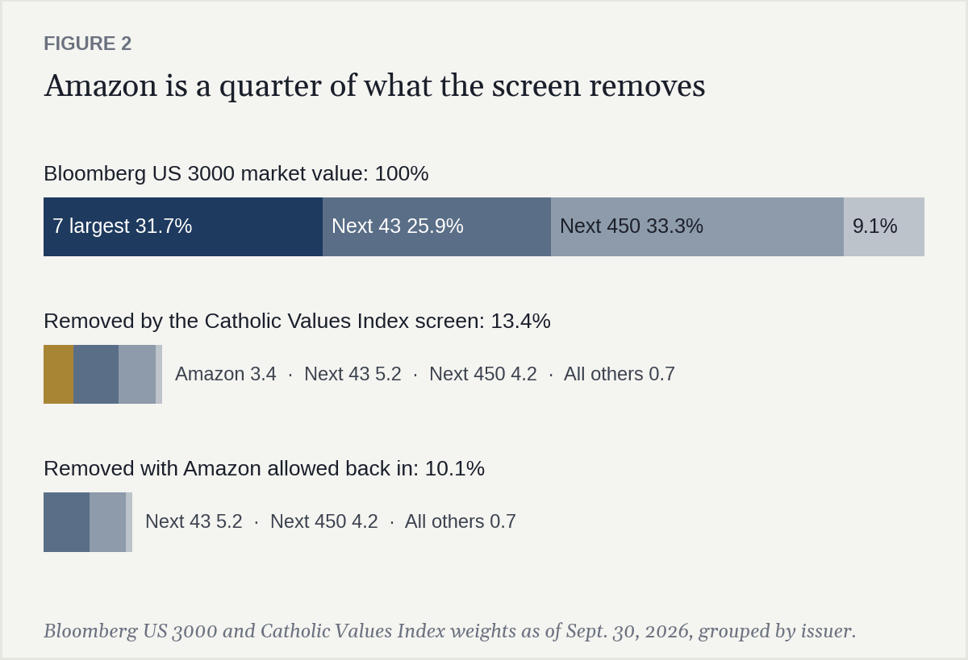
As of September 30, 2026, the Catholic index's screen excluded 245 of the secular index's securities. Together, those exclusions removed 13.4% of the secular index's value, and Amazon alone accounted for a quarter of that. We then ran the same optimizations with Amazon allowed back in, to show how much the removal of a single large company can matter.
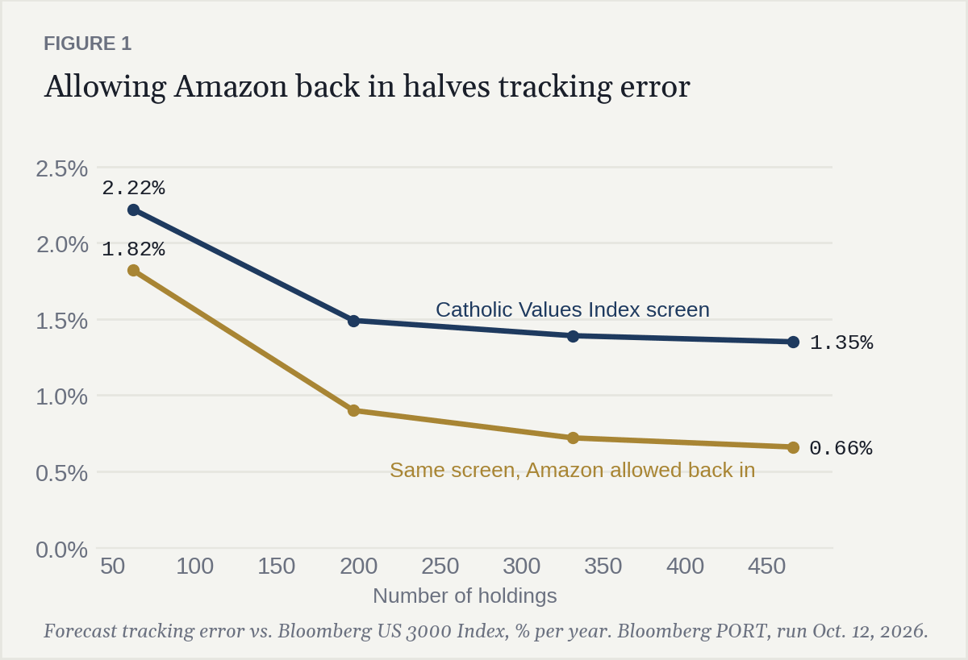
Applying the full screen (i.e., excluding Amazon), tracking error falls as the number of holdings rises: from 2.22% at 62 holdings to 1.49% at 197, and leveling off at 1.35% at 450 names (Figure 1). With Amazon allowed back in, the curve has the same shape at half the height, ending at 0.66%. Beyond about 200 holdings, adding more barely reduces tracking error in either case.
This difference comes from how concentrated the market is. On September 30, the seven largest companies in the Bloomberg 3000 index made up 31.7% of its value, and the 50 largest made up 57.6% (Figure 2). Setting aside Amazon, the screen takes a thin slice from across the market: 10.1% of its value spread over 244 securities, most of it in health care. To compensate for the impact of this screen, an optimizer can replace those companies with similar ones that remain eligible. Amazon, however, is one of the seven largest in the index, and once excluded, the optimizer cannot rebuild its exposure from the companies that remain.
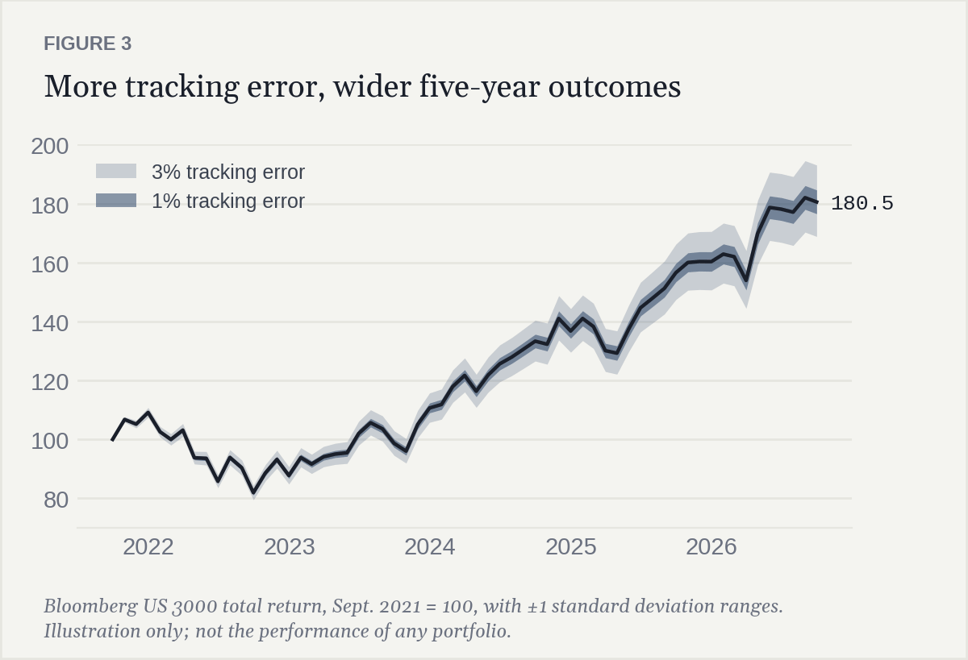
A percentage point or two of tracking error may sound trivial, but because returns compound, small yearly differences grow into large ones over time. In the five years ending September 30, 2026, the Bloomberg US 3000 Index returned 80.5% including dividends (Figure 3). A portfolio with 1% tracking error would typically have finished within about 4 percentage points of that, and one with 3% tracking error within about 12, with no way to know in advance whether it would land above or below the index.
Fortunately for investors, these effects of screening are both predictable and addressable. The cost of a set of exclusions can be measured before a portfolio is built: run the optimizer with and without the exclusions at several portfolio sizes, and compare where each tracking error curve levels off. Here, the gap between the two curves, about 0.7 percentage points, is roughly the cost of excluding Amazon. The height of the lower curve, 0.66%, is roughly the cost of the other 244 exclusions, plus the cost of having fewer holdings than the index. Knowing these costs in advance lets an investor decide how many holdings to own, and which exclusions are worth what they cost.
None of this means tracking error should always be minimized. Not all tracking error is bad: a portfolio that departs from its benchmark for good reasons may be rewarded for it. In future letters we will explore how to measure whether your tracking error is improving or degrading your portfolio's expected return and risk.
¹ Bloomberg PORT, using the Bloomberg MAC3 Global Risk Model.
² Bloomberg publishes the rules for both indexes in its US equity index methodology and its Catholic Values Index methodology.
This newsletter is general education and is not investment, tax, or legal advice.